Existing Home Sales Grow Despite Low Inventory [INFOGRAPHIC]

Existing Home Sales Grow Despite Low Inventory [INFOGRAPHIC] | Simplifying the Market

Existing Home Sales Grow Despite Low Inventory [INFOGRAPHIC] | Simplifying the Market

Some Highlights:

  • According to the latest Existing Home Sales Report from the National Association of Realtors, sales grew 1.1% in March to an annual pace of 5.60 million.
  • This is the strongest pace since November of 2017.
  • Inventory levels dropped year-over-year for the 34th consecutive month and are now 7.2% lower than March 2017 levels, representing a 3.6-month supply.

Powered by WPeMatico

Read more

“Short of a war or stock market crash…”

“Short of a war or stock market crash…” | Simplifying The Market

This month, Arch Mortgage Insurance released their spring Housing and Mortgage Market Review. The report explained that an increase in mortgage rates and/or home prices would impact monthly payments this way:

  • A 5% increase in home prices increases payments by roughly 5%
  • A 1% rise in interest rates increases payments by roughly 13% or 14%

That begs the question…

What if both rates and prices increase as predicted?

The report revealed:

“If interest rates and home prices rise by year-end in the ballpark of what most analysts are forecasting, monthly mortgage payments on a new home purchase could increase another 10–15%. That would make 2018 one of the worst full-year deteriorations in affordability for the past 25 years.”

The percent increase in mortgage payments would negatively impact affordability. But, how would affordability then compare to historic norms?

Per the report:

“For the U.S. overall, even if affordability were to deteriorate as forecasted, affordability would still be reasonable by historic norms. That is because the percentage of pre-tax income needed to buy a typical home in 2019 would still be similar to the historical average during 1987–2004. Thus, nationally at least, even with higher rates and home prices, affordability will just revert to historical norms.”

What about home prices?

A decrease in affordability will cause some concern about home values. Won’t an increase in mortgage payments negatively impact the housing market? The report addressed this question:

“Even recent interest rate increases and higher taxes on some upper-income earners didn’t slow the market, as many had feared…Short of a war or stock market crash, housing markets could continue to surprise on the upside over the next few years.”

To this point, Arch Mortgage Insurance also revealed their Risk Index which estimates the probability of home prices being lower in two years. The index is based on factors such as regional unemployment rates, affordability, net migration, housing starts and the percentage of delinquent mortgages.

Below is a map depicting their projections (the darker the blue, the lower the probability of a price decrease):

“Short of a war or stock market crash…” | Simplifying The Market

Bottom Line

If interest rates and prices continue to rise as projected, the monthly mortgage payment on a home purchased a year from now will be dramatically more expensive than it would be today.

Powered by WPeMatico

Read more

New Study Shows ‘Best States for Millennials’

New Study Shows ‘Best States for Millennials’ | Simplifying The Market

A new study by WalletHub used “30 key metrics, ranging from share of millennials to millennial unemployment rate to millennial voter-turnout rate” to find out which states are the ‘Best States for Millennials.’

The Top 5 Best States for Millennials are:

  1. Washington, D.C. (also ranks highest in percentage of millennials already living there!)
  2. North Dakota (lowest unemployment rate)
  3. Minnesota (highest millennial homeownership rate)
  4. Massachusetts (highest percentage of millennials with health insurance coverage)
  5. Iowa (ranked #1 in lowest housing cost for millennials)

Below is a map with the rankings for each of the 50 states:

New Study Shows ‘Best States for Millennials’ | Simplifying The Market

We recently reported on a study that set out to find out “How Much You Need to Make to Buy a Home in Your State,” which may have left you wondering what the average salaries are in each of the five states listed above.

According to WalletHub’s research, the top 5 states with the Highest Average Millennial Salaries are:

  1. Washington, D.C.
  2. New York
  3. Massachusetts
  4. Washington
  5. California

Every day, more and more millennials are aging into the ‘Responsibility Zone,’ the time in their lives when their responsibilities start to dictate their behaviors. For many, this includes buying a home. The top 5 states with the Highest Millennial Homeownership Rate are:

  1. Minnesota
  2. West Virginia
  3. Indiana
  4. Utah
  5. Delaware

Bottom Line

If owning a home is next on your list, let’s get together to answer any questions you may have and set you on the path to homeownership!

Powered by WPeMatico

Read more

Thinking of Selling Your Home? Why You Need A Pro in Your Corner

Thinking of Selling Your Home? Why You Need A Pro in Your Corner | Simplifying The Market

With home prices on the rise and buyer demand strong, some sellers may be tempted to try and sell their homes on their own (FSBO) without using the services of a real estate professional.

Real estate agents are trained and experienced in negotiation and, in most cases, the seller is not. Sellers must realize that their ability to negotiate will determine whether or not they get the best deal for themselves and their families.

Here is a list of some of the people with whom the seller must be prepared to negotiate if they decide to FSBO:

  • The buyer who wants the best deal possible
  • The buyer’s agent who solely represents the best interest of the buyer
  • The buyer’s attorney (in some parts of the country)
  • The home inspection companies, which work for the buyer and will almost always find some problems with the house
  • The termite company if there are challenges
  • The buyer’s lender if the structure of the mortgage requires the sellers’ participation
  • The appraiser if there is a question of value
  • The title company if there are challenges with certificates of occupancy (CO) or other permits
  • The town or municipality if you need to get the CO permits mentioned above
  • The buyer’s buyer in case there are challenges with the house your buyer is selling
  • Your bank in the case of a short sale

Bottom Line

The percentage of sellers who have hired real estate agents to sell their homes has increased steadily over the last 20 years. Let’s get together and discuss all we can do to make the process easier for you.

Powered by WPeMatico

Read more

Buying a Home Is Cheaper Than Renting in the Majority of the US

Buying a Home Is Cheaper Than Renting in the Majority of the US | Simplifying The Market

The results of the 2018 Rental Affordability Report from ATTOM show that buying a median-priced home is more affordable than renting a three-bedroom property in 54% of U.S. counties analyzed for the report.

The updated numbers show that renting a three-bedroom property in the United States requires an average of 38.8% of income.

The least affordable market for renting was Marin County, CA, just over the Golden Gate Bridge from San Francisco, where renters spend a staggering 79.5% of average wages on rent, while the most affordable market was Madison County, AL where 22.3% of average wages went to rent.

Other interesting findings in the report include:

  • Average rent rose faster than income in 60% of counties
  • Average rent rose faster than median home prices in 41% of counties
  • While median home prices rose faster than average rents in 58% of counties

Bottom Line

Buying a home makes sense socially and financially. If you are one of the many renters out there who would like to evaluate your ability to buy this year, let’s get together to find your dream home.

Powered by WPeMatico

Read more

Is Family Mortgage Debt Out of Control?

Is Family Mortgage Debt Out of Control? | Simplifying The Market

Some homeowners have recently done a “cash out” refinance and have taken a portion of their increased equity from their house. Others have sold their homes and purchased more expensive homes with larger mortgages. At the same time, first-time buyers have become homeowners and now have mortgage payments for the first time.

These developments have caused concern that families might be reaching unsustainable levels of mortgage debt. Some are worried that we may be repeating a behavior that helped precipitate the housing crash ten years ago.

Today, we want to assure everyone that this is not the case. Here is a graph created from data released by the Federal Reserve Board which shows the Household Debt Service Ratio for mortgages as a percentage of disposable personal income. The ratio is the total quarterly required mortgage payments divided by total quarterly disposable personal income. In other words, the percentage of spendable income people are using to pay their mortgage.

Is Family Mortgage Debt Out of Control? | Simplifying The Market

Today’s ratio of 4.44% is nowhere near the ratio of 7.21% during the peak of the housing bubble and is instead at the lowest rate since 1980 (4.38%).

Bill McBride of Calculated Risk recently commented on the ratio:

“The Debt Service Ratio for mortgages is near the low for the last 38 years. This ratio increased rapidly during the housing bubble and continued to increase until 2007. With falling interest rates, and less mortgage debt, the mortgage ratio has declined significantly.”

Bottom Line

Many families paid a heavy price because of questionable practices that led to last decade’s housing crash. It seems the American people have learned a lesson and are not repeating that same behavior regarding their mortgage debt.

Powered by WPeMatico

Read more

Shannon Fowler on April 18,2018

Rising Prices Help You Build Your Family’s Wealth

Over the next five years, home prices are expected to appreciate, on average, by 3.6% per year and to grow by 18.2% cumulatively, according to Pulsenomics’ most recent Home Price Expectation Survey.

So, what does this mean for homeowners and their equity position?
As an example, let’s assume a young couple purchased and closed on a $250,000 home this January. If we only look at the projected increase in the price of that home, how much equity will they earn over the next 5 years?

Since the experts predict that home prices will increase by 5.0% in 2018, the young homeowners will have gained $12,500 in equity in just one year.

Over a five-year period, their equity will increase by over $48,000! This figure does not even take into account their monthly principal mortgage payments. In many cases, home equity is one of the largest portions of a family’s overall net worth.

Bottom Line

Not only is homeownership something to be proud of, but it also offers you and your family the ability to build equity you can borrow against in the future. If you are ready and willing to buy, find out if you are able to today!

Herbert Riggs and Associates can help you with all your real estate needs. Whether buying, selling, or investing, If you have any questions, give me a call at 703-966-2647 or send me an email at Herbert.Riggs@gmail.com.

Read more

Shannon Fowler on April 18,2018

Getting Pre-Approved Should Always Be Your First Step

In many markets across the country, the number of buyers searching for their dream homes greatly outnumbers the number of homes for sale. This has led to a competitive marketplace where buyers often need to stand out. One way to show you are serious about buying your dream home is to get pre-qualified or pre-approved for a mortgage before starting your search.

Even if you are in a market that is not as competitive, understanding your budget will give you the confidence of knowing if your dream home is within your reach.

Freddie Mac lays out the advantages of pre-approval in the ‘My Home’ section of their website:

“It’s highly recommended that you work with your lender to get pre-approved before you begin house hunting. Pre-approval will tell you how much home you can afford and can help you move faster, and with greater confidence, in competitive markets.”

One of the many advantages of working with a local real estate professional is that many have relationships with lenders who will be able to help you with this process. Once you have selected a lender, you will need to fill out their loan application and provide them with important information regarding “your credit, debt, work history, down payment and residential history.”

Freddie Mac describes the ‘4 Cs’ that help determine the amount you will be qualified to borrow

Capacity: Your current and future ability to make your payments
Capital or cash reserves: The money, savings, and investments you have that can be sold quickly for cash
Collateral: The home, or type of home, that you would like to purchase
Credit: Your history of paying bills and other debts on time
Getting pre-approved is one of many steps that will show home sellers that you are serious about buying, and it often helps speed up the process once your offer has been accepted.

Bottom Line

Many potential home buyers overestimate the down payment and credit scores needed to qualify for a mortgage today. If you are ready and willing to buy, you may be pleasantly surprised at your ability to do so.

Herbert Riggs and Associates can help you with all your real estate needs. Whether buying, selling, or investing, If you have any questions, give me a call at 703-966-2647 or send me an email at Herbert.Riggs@gmail.com.

Read more

Shannon Fowler on April 18,2018

NoVA Real Estate Update – March 2018

The Northern Virginia Association of Realtors® reports on March 2018 home sales activity for Fairfax and Arlington counties, the cities of Alexandria, Fairfax and Falls Church and the towns of Vienna, Herndon and Clifton.

According to the Northern Virginia Association of Realtors, March 2018 continued the trend of tight supply of homes for sale, and stiff competition for the available homes. Buyers in the starter home market are particular impacted, because bidding wars often shut out buyers that have more modest means.

Year over year totals of home sold were off less than 1%. March 2018 saw a total of 1,768 homes sold, compared to 1,779 homes sold in March 2017.

Market uncertainty and rising interest rates may be causing some sellers to stay on the sidelines. Active listings decreased in March 2018 when compared with March 2017 — down about 21 percent below last year, with 2,891 active listings in March, compared with 3,667 homes available in March 2017.

Demonstrated continued strong demand, despite lack of available homes, the average days on market (DOM) for was 42 days in March 2018, compared to the 52 DOM for homes in March 2017. This is a a decrease of about 19 percent.

The average home sale price remains comparatively flat year over year.  March 2018 reflects average prices at $568,576, up by barely 1 percent compared to a year prior, with an average price of $565,964.

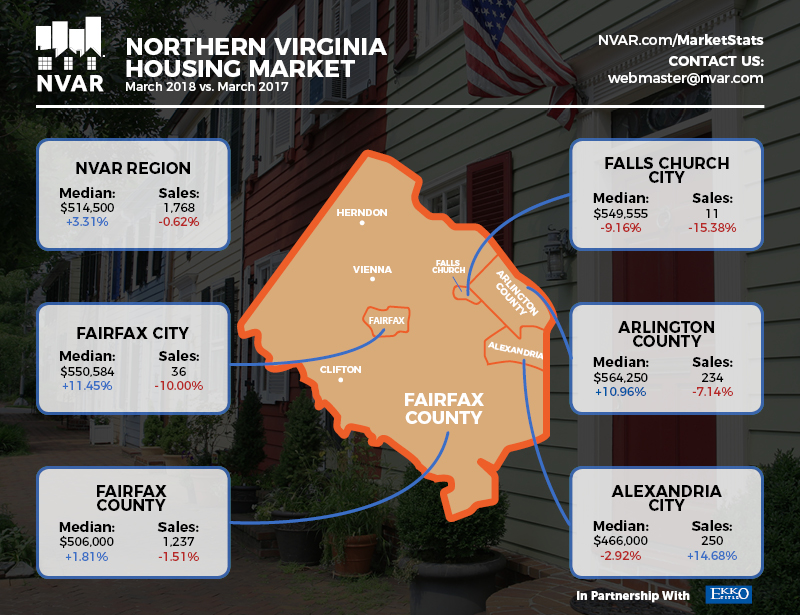
The median sold price was $514,500 for homes sold in March 2018, which is an increase of 3.31 percent compared to the median price of $498,000 in March 2017.

As expected when fewer homes are available on the market, pending home sales in Northern Virginia in March 2018 were 7.25 percent below March of last year. Total pending sales were off by 10.72 percent compared with the pending contracts in March 2017.

While the markets pose some challenges, for those who have been saving and preparing for a new home purchase can still find opportunities. As interest rates and prices are expected to continue to rise, waiting could cost you money in the long run.

Herbert Riggs and Associates can help you with all your real estate needs. Whether buying, selling, or investing, If you have any questions, give me a call at 703-966-2647 or send me an email at Herbert.Riggs@gmail.com.

Read more

How Much Do You Need to Make to Buy a Home in Your State?

How Much Do You Need to Make to Buy a Home in Your State? | Simplifying The Market

It’s no mystery that cost of living varies drastically depending on where you live, so a new study by GOBankingRates set out to find out what minimum salary you would need to make in order to buy a median-priced home in each of the 50 states, and Washington, D.C.

States in the Midwest came out on top as most affordable, requiring the smallest salaries in order to buy a median-priced home. States with large metropolitan areas saw a bump in the average salary needed to buy with California, Washington, D.C., and Hawaii edging out all others with the highest salaries required.

Below is a map with the full results of the study:

How Much Do You Need to Make to Buy a Home in Your State? | Simplifying The Market

GoBankingRates gave this advice to anyone considering a home purchase,

“Before you buy a home, it’s important to find out if you can afford the monthly mortgage payment. To do this, some financial experts recommend your housing costs — primarily your mortgage payments — shouldn’t consume more than 30 percent of your monthly income.”

As we recently reported, research from Zillow shows that historically, Americans had spent 21% of their income on owning a median-priced home. The latest data from the fourth quarter of 2017 shows that the percentage of income needed today is only 15.7%!

Bottom Line

If you are considering buying a home, whether it’s your first time or your fifth time, let’s get together to evaluate your ability to do so in today’s market!

Powered by WPeMatico

Read more

Rising Prices Help You Build Your Family’s Wealth

Rising Prices Help You Build Your Family’s Wealth | Simplifying The Market

Over the next five years, home prices are expected to appreciate, on average, by 3.6% per year and to grow by 18.2% cumulatively, according to Pulsenomics’ most recent Home Price Expectation Survey.

So, what does this mean for homeowners and their equity position?

As an example, let’s assume a young couple purchased and closed on a $250,000 home this January. If we only look at the projected increase in the price of that home, how much equity will they earn over the next 5 years?

Rising Prices Help You Build Your Family’s Wealth | Simplifying The Market

Since the experts predict that home prices will increase by 5.0% in 2018, the young homeowners will have gained $12,500 in equity in just one year.

Over a five-year period, their equity will increase by over $48,000! This figure does not even take into account their monthly principal mortgage payments. In many cases, home equity is one of the largest portions of a family’s overall net worth.

Bottom Line

Not only is homeownership something to be proud of, but it also offers you and your family the ability to build equity you can borrow against in the future. If you are ready and willing to buy, find out if you are able to today!

Powered by WPeMatico

Read more

Getting Pre-Approved Should Always Be Your First Step

Getting Pre-Approved Should Always Be Your First Step | Simplifying The Market

In many markets across the country, the number of buyers searching for their dream homes greatly outnumbers the number of homes for sale. This has led to a competitive marketplace where buyers often need to stand out. One way to show you are serious about buying your dream home is to get pre-qualified or pre-approved for a mortgage before starting your search.

Even if you are in a market that is not as competitive, understanding your budget will give you the confidence of knowing if your dream home is within your reach.

Freddie Mac lays out the advantages of pre-approval in the ‘My Home’ section of their website:

“It’s highly recommended that you work with your lender to get pre-approved before you begin house hunting. Pre-approval will tell you how much home you can afford and can help you move faster, and with greater confidence, in competitive markets.”

One of the many advantages of working with a local real estate professional is that many have relationships with lenders who will be able to help you with this process. Once you have selected a lender, you will need to fill out their loan application and provide them with important information regarding “your credit, debt, work history, down payment and residential history.”

Freddie Mac describes the ‘4 Cs’ that help determine the amount you will be qualified to borrow:

  1. Capacity: Your current and future ability to make your payments
  2. Capital or cash reserves: The money, savings, and investments you have that can be sold quickly for cash
  3. Collateral: The home, or type of home, that you would like to purchase
  4. Credit: Your history of paying bills and other debts on time

Getting pre-approved is one of many steps that will show home sellers that you are serious about buying, and it often helps speed up the process once your offer has been accepted.

Bottom Line

Many potential home buyers overestimate the down payment and credit scores needed to qualify for a mortgage today. If you are ready and willing to buy, you may be pleasantly surprised at your ability to do so.

Powered by WPeMatico

Read more

A Tale of Two Markets [INFOGRAPHIC]

A Tale of Two Markets [INFOGRAPHIC] | Simplifying The Market 

Some Highlights:

  • A trend that has been emerging for some time now is the contrast between inventory & demand in the Premium & Luxury Markets vs. the Starter & Trade-Up Home Markets and what that’s, in turn, doing to prices!
  • Inventory continues to rise in the luxury & premium home markets which is causing prices to cool.
  • Demand continues to rise with low inventory in the starter & trade-up home markets, causing prices to rise!

Powered by WPeMatico

Read more

The COST of Your Next Home Will Be LESS Than Your Parents’ Home Was

The COST of Your Next Home Will Be LESS Than Your Parents' Home Was | Simplifying The Market

There is no doubt that the price of a home in most regions of the country is greater now than at any time in history. However, when we look at the cost of a home, it is cheaper to own today than it has been historically.

The Difference Between PRICE and COST

The price of a home is the dollar amount you and the seller agree to at the time of purchase. The cost of a home is the monthly expense you pay for your mortgage payment.

To accurately compare costs in different time periods, we must look at home prices, mortgage rates, and wages during each period. Home prices were less expensive years ago, but paychecks were also smaller and mortgage rates were much higher (the average mortgage interest rate in 1988 was 10.34%).

The best way to measure the COST of a home is to determine what percentage of income is necessary to buy a home at the time. That would take into account the price of the home, the mortgage interest rate and wages at the time.

Zillow just released research that examined home costs using this formula. The research compares the historic percentage of income necessary to afford a mortgage to the percentage needed today. It also revealed the cost if mortgage rates continue to rise as experts are predicting. Here is a graph of their findings*:

The COST of Your Next Home Will Be LESS Than Your Parents' Home Was | Simplifying The Market

Rates would need to jump to 7% in order for the percentage of necessary income to be greater than historic norms.

Bottom Line

Whether you are a homeowner considering selling your current house and moving up to the home of your dreams, or a first-time buyer trying to purchase your first home, it’s a great time to move forward.

*Assumptions in the Zillow report: Buyer puts 20% down, takes out a conforming, 30-year fixed-rate mortgage at rates prevailing at the time, earns the median household income, and is buying a median-valued home.

Powered by WPeMatico

Read more

Mortgage Interest Rates Have Begun to Level Off

Mortgage Interest Rates Have Begun to Level Off | Simplifying The Market

Whether you are a buyer searching for your first home, or a homeowner looking to move up to your next home, you should pay attention to where mortgage interest rates are heading.

Over the course of 2018, according to Freddie Mac’s Primary Mortgage Market Survey, rates have increased from 3.95% in the first week of January to 4.40% in the first week of April.

At first glance, the difference between these numbers in such a short amount of time could be concerning, but if we look at the graph below, we’ll see that rates have already started to level off and return to the mark set in February.

Mortgage Interest Rates Have Begun to Level Off | Simplifying The Market

This is great news for anyone looking to buy a home this spring! The spring is always one of the busiest seasons for home buying, and with rates increasing even more, buyers have come off the fence to lock in great rates! This is still great advice as the experts believe that rates will continue to rise throughout the year.

Every month, Freddie Mac, Fannie Mae, the Mortgage Bankers Association and the National Association of Realtors release their projections for where they believe mortgage rates will be in the coming months. If we take the average of what each of the four organizations is predicting for the second quarter, rates are expected to rise to about 4.48% by June.

That average climbs to 4.73% by the end of this year.

So, what does this mean?

Waiting until the end of the year to buy, with rates still projected to increase, will end up costing you more money on your monthly mortgage payment. For every $250,000 you need to borrow to purchase your dream home, you will spend $49.21 more per month, $590.52 per year, and over $17,700 by the end of your 30-year mortgage.

And that’s just the impact of your interest rate going up!

Bottom Line

If you are ready and willing to purchase a home, find out if you’re able to. Let’s get together to evaluate your needs and help you with next steps!

Powered by WPeMatico

Read more

What Is Private Mortgage Insurance (PMI)?

What Is Private Mortgage Insurance (PMI)? | Simplifying The Market

When it comes to buying a home, whether it is your first time or your fifth, it is always important to know all the facts. With the large number of mortgage programs available that allow buyers to purchase homes with down payments below 20%, you can never have too much information about Private Mortgage Insurance (PMI).

What is PMI?

Freddie Mac defines PMI as:

“An insurance policy that protects the lender if you are unable to pay your mortgage. It’s a monthly fee, rolled into your mortgage payment, that is required for all conforming, conventional loans that have down payments less than 20%.

Once you’ve built equity of 20% in your home, you can cancel your PMI and remove that expense from your mortgage payment.”

 As the borrower, you pay the monthly premiums for the insurance policy, and the lender is the beneficiary. Freddie Mac goes on to explain that:

“The cost of PMI varies based on your loan-to-value ratio – the amount you owe on your mortgage compared to its value – and credit score, but you can expect to pay between $30 and $70 per month for every $100,000 borrowed.” 

According to the National Association of Realtors, the average down payment for all buyers last year was 10%. For first-time buyers, that number dropped to 5%, while repeat buyers put down 14% (no doubt aided by the sale of their homes). This just goes to show that for a large number of buyers last year, PMI did not stop them from buying their dream homes.

Here’s an example of the cost of a mortgage on a $200,000 home with a 5% down payment & PMI, compared to a 20% down payment without PMI:

What Is Private Mortgage Insurance (PMI)? | Simplifying The Market

The larger the down payment you can make, the lower your monthly housing cost will be, but Freddie Mac urges you to remember:

“It’s no doubt an added cost, but it’s enabling you to buy now and begin building equity versus waiting 5 to 10 years to build enough savings for a 20% down payment.”

Bottom Line

If you have questions about whether you should buy now or wait until you’ve saved a larger down payment, let’s get together to discuss our market’s conditions and help you make the best decision for you and your family.

Powered by WPeMatico

Read more

US Housing Market Still In ‘Buy Territory’!

US Housing Market Still In ‘Buy Territory’! | Simplifying The Market

According to the Beracha, Hardin & Johnson Buy vs. Rent (BH&J) Index, the U.S. housing market has continued to move deeper into buy territory, supporting the belief that housing markets across the country remain a sound investment.

The BH&J Index is a quarterly report that attempts to answer the question:

In today’s housing market, is it better to rent or buy a home?

The index examines the entire US housing market and then isolates 23 major cities for comparison. The researchers “measure the relationship between purchasing property and building wealth through a buildup in equity versus renting a comparable property and investing in a portfolio of stocks and bonds.” 

While 13 of the 23 metropolitan markets examined moved further into buy territory, markets like Dallas, Denver, and Houston are currently deep into rent territory. Due to a lack of inventory, the home prices in these areas have increased by 6.7%6.3%, and 5.3%  respectively from a year ago.

According to Eli Beracha, Ph.D., Co-Creator of the index, home prices will begin to return to more normal levels.

Our data indicates that prices are above their 40-year trend but not significantly so as they were in 2007. Rather than a crash, I anticipate slower growth in prices accompanied by longer marketing times for sellers and increasing inventories, which should bring prices back in conjunction with their 40-year trend.”

Bottom Line

The majority of the country is strongly in buy territory. Buying a home makes sense socially and financially, as rents are predicted to increase substantially in the next year. Protect yourself from rising rents by locking in your housing cost with a mortgage payment now. 

To Find Out More About the Study: The BH&J Index and other FAU real estate activities are sponsored by Investments Limited of Boca Raton. The BH&J Index is published quarterly and is available online at http://business.fau.edu/buyvsrent.

Powered by WPeMatico

Read more

VA Loans by the Numbers [INFOGRAPHIC]

VA Loans by the Numbers [INFOGRAPHIC] | Simplifying The Market

Some Highlights:

  • Since the creation of the VA Home Loans Program, 22 million veterans have been able to achieve the American Dream of homeownership.
  • In 2017, $188 billion was loaned to veterans and their families through the program.
  • VA Purchase Loans are on the rise in 46 out of 50 states and Washington, DC.

Powered by WPeMatico

Read more

House Prices: Simply a Matter of Supply & Demand

House Prices: Simply a Matter of Supply & Demand | Simplifying The Market

Why are home prices still rising? It is a simple answer. There are more purchasers in the market right now than there are available homes for them to buy. This is an example of the theory of “supply and demand” which is defined as:

“the amount of a commodity, product, or service available and the desire of buyers for it, considered as factors regulating its price.”

When demand exceeds supply, prices go up. This is currently happening in the residential real estate market.

Here are the numbers for supply and demand as compared to last year for the last three months (March numbers are not yet available):

House Prices: Simply a Matter of Supply & Demand | Simplifying The Market

In each of the last three months, demand (buyer traffic) has increased as compared to last year while supply (number of available listings) has decreased. If this situation persists, home values will continue to increase.

Bottom Line

The reason home prices are still rising is because there are many purchasers looking to buy, but very few homeowners ready to sell. This imbalance is the reason prices will remain on the uptick.

Powered by WPeMatico

Read more

Boomerang Buyers: Most Qualify for Financing in 2-3 Years

Boomerang Buyers: Most Qualify for Financing in 2-3 Years | Simplifying The Market

According to a new study from Lending Tree, Americans who have filed for bankruptcy may be able to rebuild enough credit to qualify for a home loan in as little as 2-3 years.

This is in stark contrast to the belief that many have that they need to wait 7-10 years for their bankruptcies to clear from their credit reports before attempting to apply for either a mortgage or a personal or auto loan.

The study analyzed over one million loan applications for mortgages, personal, and auto loans and compared borrowers who had a bankruptcy on their credit report vs. those who did not to find out the “Cost of Bankruptcy.”

The study found that 43.2% of Americans who filed bankruptcy were able to repair their credit back to a 640 FICO® Score in less than a year. The percentage of those who achieved a 640 FICO® Score increased to nearly 75% after 5 years. The full breakdown of the findings was used to create the chart below.

Boomerang Buyers: Most Qualify for Financing in 2-3 Years | Simplifying The Market

Americans who were able to repair their credit scores to a range of 720-739 within three years of filing were able to obtain the same financing options as those who had never filed bankruptcy.

According to Ellie Mae’s latest Origination Insights Report, 53.5% of those who were approved for a home loan had FICO® Scores between 600-749 last month. This is great news for Americans who are looking to re-enter the housing market.

Boomerang Buyers: Most Qualify for Financing in 2-3 Years | Simplifying The Market

Raj Patel, Lending Tree’s Director of Credit Restoration & Debt-Related Services had this to say:

“People may think that filing a bankruptcy would put you out of the loan market for seven to ten years, but this study shows that it is possible to rebuild your credit to a good credit quality.”

“LendingTree’s research found that very few bankruptcy filers have a harder time [obtaining a mortgage] than those who have not filed for bankruptcy.”

Bottom Line

If you are one of the millions of Americans who has filed for bankruptcy and think that you have to wait 7-10 years to make your dream of returning to homeownership a reality, let’s get together to find out if you qualify now.

Powered by WPeMatico

Read more

What Should You Look for In Your Real Estate Team?

What Should You Look for In Your Real Estate Team? | Simplifying The Market

How do you select the members of your team who are going to help make your dream of owning a home a reality? What should you be looking for? How do you know if you’ve found the right agent or lender?

The most important characteristic that you should be looking for in your agent is someone who is going to take the time to really educate you on the choices available to you and your ability to buy in today’s market.

As the financial guru Dave Ramsey advises:

“When getting help with money, whether it’s insurance, real estate or investments, you should always look for someone with the heart of a teacher, not the heart of a salesman.”

Do your research. Ask your friends and family for recommendations of professionals they’ve worked with in the past and have had good experiences with.

Look for members of your team who will be honest and trustworthy; after all, you will be trusting them to help you make one of the biggest financial decisions of your life.

Whether this is your first or fifth time buying a home, you want to make sure that you have an agent who is going to have the tough conversations with you, not just the easy ones. If your offer isn’t accepted by the seller, or they think that there may be something wrong with the home that you’ve fallen in love with, you would rather know what they think than make a costly mistake.

According to the Home Buyer and Seller Generational Trends Report:

Buyers from all generations primarily wanted their agent’s help to find the right home to purchase. Buyers were also looking for help to negotiate the terms of sale and to help with price negotiations.” Additionally, “Help understanding the purchase process was most beneficial to buyers 37 years and younger at 75 percent.”

Look for someone to invest in your family’s future with you. You want an agent who isn’t focused on the transaction but is instead focused on helping you understand the process while helping you find your dream home.

Bottom Line

In this world of Google searches, where it seems like all the answers are just a mouse-click away, you need an agent who is going to educate you and share the information that you need to know before you even know you need it.

Powered by WPeMatico

Read more

NOT Owning Your Home Can Cost You a Lot of Money!

NOT Owning Your Home Can Cost You a Lot of Money! | Simplifying The Market

Owning a home has great financial benefits, yet many continue to rent! Today, let’s look at the financial reasons why owning a home of your own has been a part of the American Dream for as long as America has existed.

Realtor.com recently reported that:

Buying remains the more attractive option in the long term – that remains the American dream, and it’s true in many markets where renting has become really the shortsighted option… as people get more savings in their pockets, buying becomes the better option.”

What proof exists that owning is financially better than renting?

1. In a previous blog we highlighted the top 5 financial benefits of homeownership:

  • Homeownership is a form of forced savings.
  • Homeownership provides tax savings.
  • Homeownership allows you to lock in your monthly housing cost.
  • Buying a home is cheaper than renting.
  • No other investment lets you live inside of it.

2. Studies have shown that a homeowner’s net worth is 44x greater than that of a renter.

3. Just a few months ago, we explained that a family that purchased an average-priced home at the beginning of 2018 could build more than $44,000 in family wealth over the next five years.

4. Some argue that renting eliminates the cost of taxes and home repairs, but every potential renter must realize that all the expenses the landlord incurs are already baked into the rent payment– along with a profit margin!!

Bottom Line

Owning a home has always been, and will always be, better from a financial standpoint than renting.

Powered by WPeMatico

Read more

The Cost of Renting vs. Buying Today [INFOGRAPHIC]

The Cost of Renting vs. Buying Today [INFOGRAPHIC] | Simplifying The Market

Some Highlights:

  • Historically, the choice between renting or buying a home has been a tough decision.
  • Looking at the percentage of income needed to rent a median-priced home today (28.9%) vs. the percentage needed to buy a median-priced home (15.7%), the choice becomes obvious.
  • Every market is different. Before you renew your lease again, find out if you can put your housing costs to work by buying this year!

Powered by WPeMatico

Read more

99% of Experts Agree: Home Prices Will Increase

99% of Experts Agree: Home Prices Will Increase | Simplifying The Market

Some believe that the combined effects of the new tax code and rising mortgage rates will have an adverse impact on residential real estate prices in 2018. However, the clear majority of recently surveyed housing experts believe that home values will continue to rise this year.

What is the Home Price Expectation Survey?

Each quarter, Pulsenomics surveys a nationwide panel of economists, real estate experts and investment & market strategists. Those surveyed include experts such as:

  • Daniel Bachman, Senior Manager, U.S. Economics at Deloitte Services, LP
  • Kathy Bostjancic, Head of U.S. Macro Investors Service at Oxford Economics
  • David Downs, Real Estate Finance Professor at VCU
  • Edward Pinto, Resident Fellow at American Enterprise Institute
  • Albert Saiz, Director at MIT Center for Real Estate

Where do these experts see home values headed in 2018?

Here is a breakdown of where they see home values twelve months from now:

  • 21.6% believe prices will appreciate by 6% or more
  • 71.6% believe prices will appreciate between 3 and 5.99%
  • 5.7% believe prices will appreciate between 0 and 2.99%
  • Only 1.1% believe prices will depreciate

Bottom Line

Almost ninety-nine percent of the top experts studying residential real estate believe that prices will appreciate this year, and over 93% believe home values will appreciate by at least 3%.

Powered by WPeMatico

Read more

The given key was not present in the dictionary.

Server Error in '/' Application.

The given key was not present in the dictionary.

Description: An unhandled exception occurred during the execution of the current web request. Please review the stack trace for more information about the error and where it originated in the code.

Exception Details: System.Collections.Generic.KeyNotFoundException: The given key was not present in the dictionary.

Source Error:

An unhandled exception was generated during the execution of the current web request. Information regarding the origin and location of the exception can be identified using the exception stack trace below.

Stack Trace:


[KeyNotFoundException: The given key was not present in the dictionary.]
   System.ThrowHelper.ThrowKeyNotFoundException() +39
   System.Collections.Generic.Dictionary`2.get_Item(TKey key) +52
   DiverseSolutions.Beast.API.Controllers.APIController.Disclaimer(DisclaimerResponseDirective responseDirective) in c:\jenkins\workspace\Diverse_DotNet_Jobs\beast-api\beast-api\App\Controllers\Disclaimer.cs:38
   lambda_method(Closure , ControllerBase , Object[] ) +139
   System.Web.Mvc.ReflectedActionDescriptor.Execute(ControllerContext controllerContext, IDictionary`2 parameters) +279
   System.Web.Mvc.ControllerActionInvoker.InvokeActionMethod(ControllerContext controllerContext, ActionDescriptor actionDescriptor, IDictionary`2 parameters) +35
   System.Web.Mvc.<>c__DisplayClass15.<InvokeActionMethodWithFilters>b__12() +80
   System.Web.Mvc.ControllerActionInvoker.InvokeActionMethodFilter(IActionFilter filter, ActionExecutingContext preContext, Func`1 continuation) +474
   System.Web.Mvc.ControllerActionInvoker.InvokeActionMethodFilter(IActionFilter filter, ActionExecutingContext preContext, Func`1 continuation) +474
   System.Web.Mvc.ControllerActionInvoker.InvokeActionMethodFilter(IActionFilter filter, ActionExecutingContext preContext, Func`1 continuation) +474
   System.Web.Mvc.ControllerActionInvoker.InvokeAction(ControllerContext controllerContext, String actionName) +2170
   System.Web.Mvc.Controller.ExecuteCore() +113
   System.Web.Mvc.ControllerBase.Execute(RequestContext requestContext) +91
   System.Web.Mvc.<>c__DisplayClassb.<BeginProcessRequest>b__5() +68
   System.Web.Mvc.Async.<>c__DisplayClass1.<MakeVoidDelegate>b__0() +25
   System.Web.Mvc.Async.AsyncResultWrapper.End(IAsyncResult asyncResult, Object tag) +10
   System.Web.CallHandlerExecutionStep.System.Web.HttpApplication.IExecutionStep.Execute() +5423
   System.Web.HttpApplication.ExecuteStepImpl(IExecutionStep step) +220
   System.Web.HttpApplication.ExecuteStep(IExecutionStep step, Boolean& completedSynchronously) +2407


Version Information: Microsoft .NET Framework Version:4.0.30319; ASP.NET Version:4.8.4676.0